Lab Learning Analytics and Visual Analytics
Lab Course: Learning Analytics and Visual Analytics (LAVA) (WS 19/20)
Semester: Winter Semester 2019/20
Lab language: English
Exam language: English
Exam type: Prototype, Presentation, Report
Maximum number of participants: 16
About this course
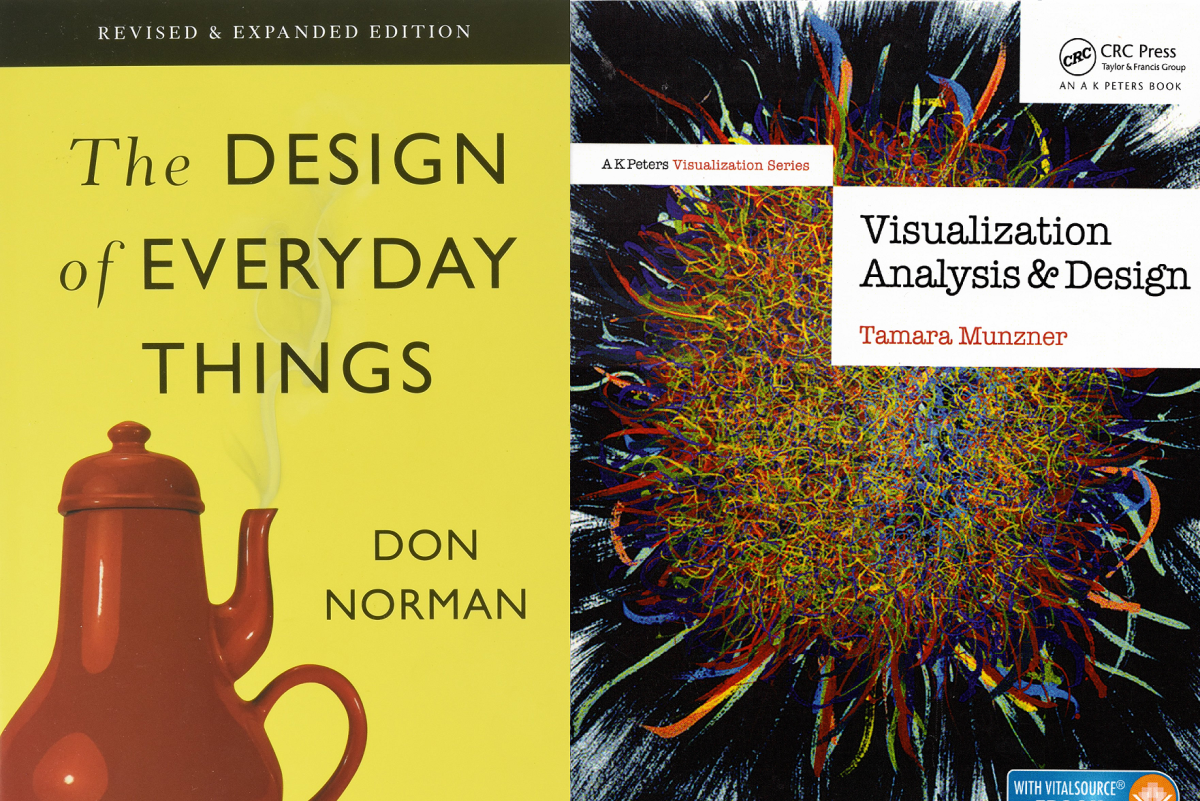
During this year's Learning Analytics and Visual Analytics (LAVA) project, you will systematically design and implement interactive visualizations of an educational dataset of your choice, following the Human-Centered Design (HCD) process proposed by Norman (2013) and the What-Why-How visualization analysis framework proposed by Munzner (2014).
You will organize yourselves in groups of 4. In the first few weeks of the lab, we will provide a general overview on HCD and visualization libraries (e.g. D3.js). There will be weekly tasks which include:
- Reading, presenting, and discussing selected chapters from the Visualization Analysis and Design book (Munzner, 2014)
- Project presentations (ideas/concepts, prototypes, end product, demos)
- Writing a project report in form of a scientific article
Grading for this lab will be based on the content and quality of the project presentations and report as well as your performance (project management and collaboration, class participation, creativity) during the project.
Target audience
- Master Applied Computer Science
- Master ISE CE
- Master Komedia
- Bachelor Komedia
4 places for each study program
Date and location
- Mon, 16:00 – 18:00
- LB 239
- Starts on October 14th, 2019
Prerequisites
- Good knowledge of basic Web technologies such as HTML, CSS, JavaScript
- Past participation in our lecture courses Advanced Web Technologies and Learning Analytics is important, but not mandatory
- Interest in visual analytics and/or learning technologies
- High motivation and commitment
Registration
We have 4 places for each of the study programs: Master AI, Master ISE CE, Master Komedia, Bachelor Komedia (first come first serve). To register, please send an email to Dr. Arham Muslim by October 1st, 2019 with your contact information, your study program, and if available your knowledge/experience in Visual Analytics and Learning Technologies. If the maximum number of participants is reached, we will use a waiting list. Komedia Bachelor students should register via the central registration system.
Organization
Instructors
For any questions about the class, please contact Dr. Arham Muslim.
Prof. Dr. Mohamed Chatti (Lecturer)
Dr. Arham Muslim (Teaching Assistant)
Literature
- Munzner, T. (2014). Visualization Analysis and Design. AK Peters/CRC Press.
- Ward, M. O., Grinstein, G., & Keim, D. (2010). Interactive Data Visualization: Foundations, Techniques, and Application. AK Peters/CRC Press.
- Ware, C. (2004). Information Visualization: Perception for Design (2nd Edition). Elsevier.
- Norman, D. (2013). The Design of Everyday Things. New York: Basic Books
- Dix, A., Finlay, J. E., Abowd, G. D., and Beale, R. (2004). Human-Computer Interaction (4th Edition). Prentice-Hall, Inc., Upper Saddle River, NJ, USA.
Student Projects
studySoon
Group name: InsightOut
Group members: Kaser Mahmoud, Laura Vorgerd
Project description:
In this work we present studySoon, an interactive visualization tool that helps pupils to compare three study programs of the University of Duisburg Essen. By using several charts (pie chart, bar chart, etc.) coupled with user interactions (filter, hover, OnClick), we show how data visualization can be used effectively in the educational context.
Links: GitHub, Live Demo, Deployed Version

INTOGEN
Group name: JAAY
Group members: Yixin Haung, Jaleh Ghorbani, Aalli Mahmood
Project description:
Every human being learns from experiences, everyone has his/her preferred learning styles by which they learn in their everyday life. In this project, we aim at improving students learning experiences by identifying students learning styles through David kolb’s learning cycle. The Idea was to identify students learning styles by kolb’s questionnaire in order to suggest them courses according to their preferred learning styles.
Links: GitHub-Frontend,GitHub-Backend, Live Demo, Deployed Version
ISE Assist
Group name: Helping Mankind
Group members: Tianyu Zhu, Muhammad Dawar, Hasan Halacli
Project description:
ISE ASSIST is an interactive visualization tool that allows students to search for anything from information about a certain major to the details of a specific course. This tool allows students to compare different majors conveniently. The results will be displayed through concise idioms, simplifying the students' progress to keep track of their academic performances.
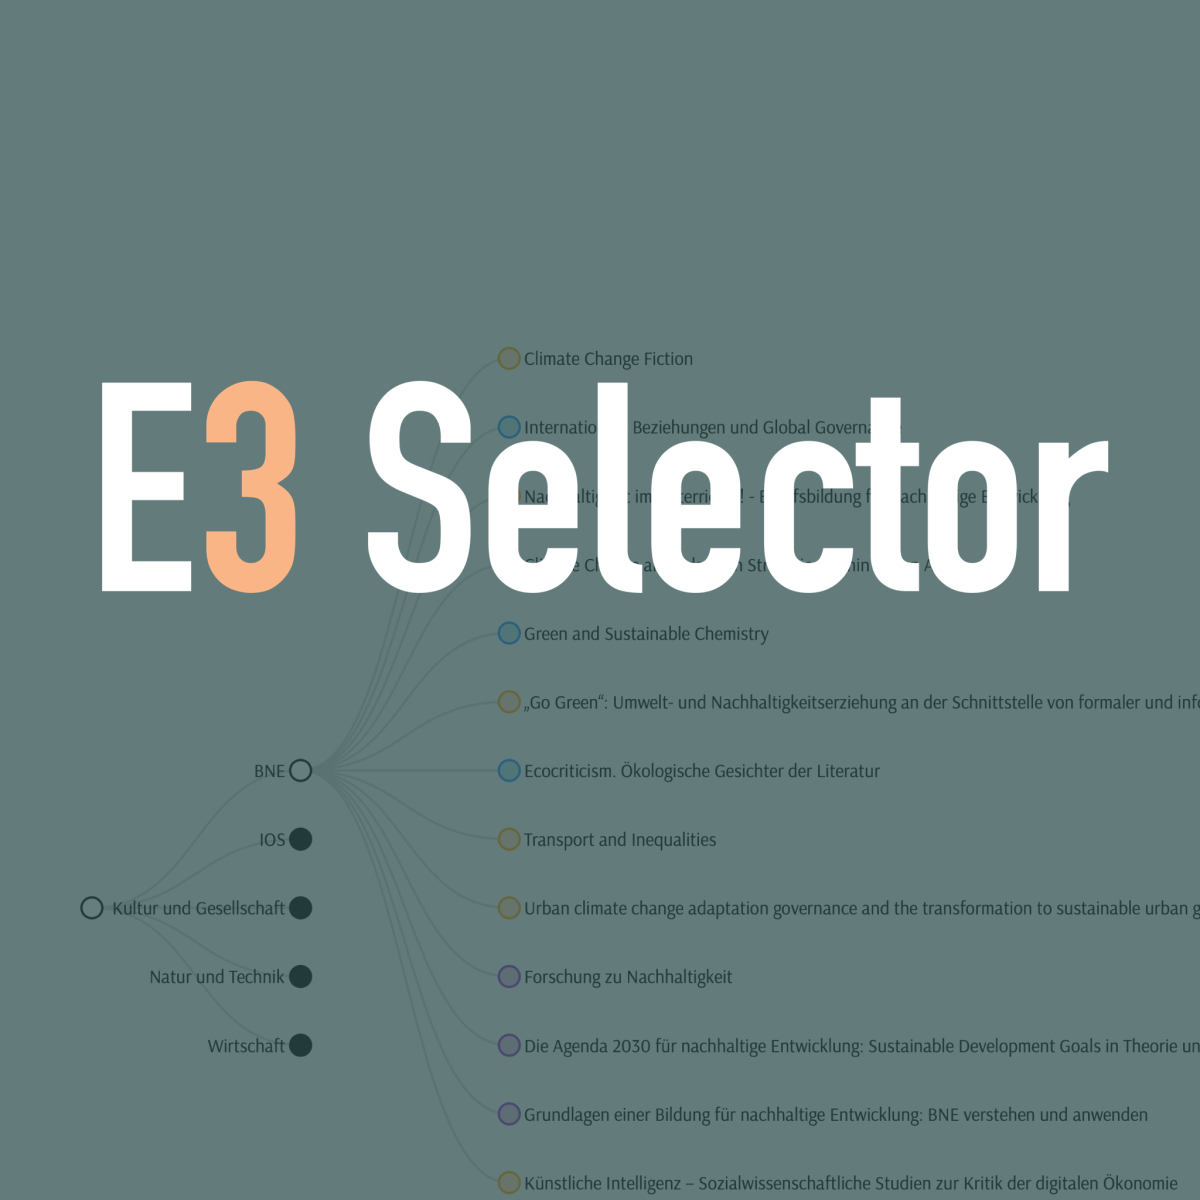
E3 Selector
Group name: MAY
Group members: Yuewei Ma, Marie Bexte, Aynaz Khoshkhoo
Project description:
E3 courses make up a special course catalog relevant to all Bachelor students of the University of Duisburg-Essen. This project determined issues students have with the selection of these courses via the universities course management portal. Following the Human Centered Indicator Design approach, a web application was developed in cooperation with its possible future users, aiming to arrive at a solution that improves course handling over the system provided by the university.
Links: GitHub, Deployed Version