Analytical Techniques
Please find below a selection of available analytical techniques. Many more applications can be realized on demand – just let us know your needs.
Whole Proteome Analysis (WPA)
Whole proteome analysis is a label-free quantification method and is one of the most frequently applied MS techniques. Samples from two (or more) differentially treated sample sets (e.g. cells treated with an inhibitor and a vehicle or cells in different cell states) are prepared for MS analysis (digestion by e.g. trypsin, reduction/alkylation and stage tipping) and are then analyzed by LC-MS without further modification. The results from the MS analysis for all sample sets is then analyzed together by appropriate software (e.g. MaxQuant) that extracts, normalizes and records the MS1 intensities of each peptide peak at the apex. These values are then compared individually for each protein over all samples and reflect the relative changes in protein abundance.
Affinity Purification/enrichment-MS (AP/AE-MS) and related methods
Affinity purification or enrichment mass spectrometry is a “continuation” of the WPA approach. It allows the interrogation of a subset of the proteome, e.g. the interaction partners of a protein or molecule of interest. In this approach a small molecule, protein or antibody is linked to a suitable support (e.g. by anchorage of a specific antibody or by linking a biotin-modified small molecule to a streptavidin-coated resin, see image below). Interacting proteins will bind to this linker, resulting in retention on the solid support. After extensive washes to remove unspecific but not specific interactors, the samples will be either on-bead digested (OBD) or, after elution, in-solution digested (ISD). The resulting peptide mix will then be prepared for mass spectrometry (reduction, alkylation, stagetipping) and analyzed via a label-free quantification workflow.
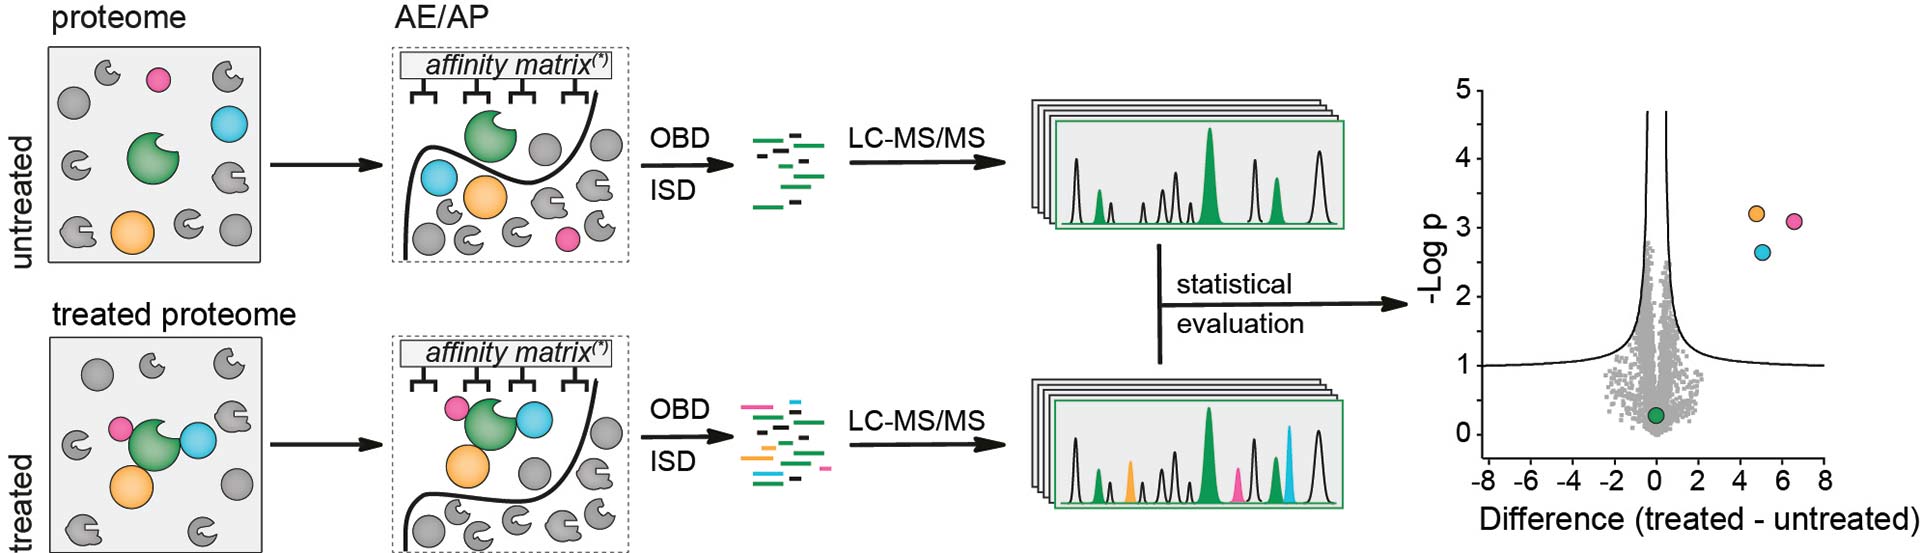
Schematic representation of a prototypical AE/AP MS approach. Treated and untreated samples are passed over an affinity resin. The resin can be coated with Ni-NTA or glutathione if the protein of interest is tagged with 6xHIS or GST or with a specific antibody e.g. if FLAG or myc tag is used. Enriched proteins are on-bead or after elution in-solution-digested and analysed by LC-MS/MS. Statistical evaluation is achieved by comparing a suitable control with the real experiment.
Identification of post-translational modifications (PTM-MS)
Post-translational modifications (PTMs) such as phosphorylation and ubiquitylation are among the most prevalent protein modifications within the cells. The identification and in particular the time-resolved quantification of these events is very important to understand the underlying biology.
In many instances, the state of a signal pathway cannot be determined by determining protein abundances. Instead, signal transduction is closely linked to the phosphorylation state of particular serine/threonine or tyrosine containing motives in proteins of a signaling cascade. In these cases, it is imperative not only to detect but also to quantify these phosphorylation events in a time-dependent fashion. In order to analyze the phosphoproteome, we established the EasyPhos workflow in which proteome samples are fully digested, the phosphopeptides are enriched on TiO2 beads and analyzed by label-free quantification using LC/MS. As not all phosphopeptides favourably interact with TiO2, we are currently in the progress to establish other enrichment methodologies and hope to increase the robustness and coverage of the analyses.
Please note one important thing … PTM analysis is not trivial and usually requires a specific purification/fractionation/enrichment step before MS. If you are interested in a specific PTM please contact us and we can discuss what needs to be done.
Cross-linking MS
Cross-linking MS (CL-MS) is a powerful method that facilitates the identification of protein-protein interaction and at the same time can deliver detailed information about protein-protein interaction surfaces. There are several strategies for performing crosslinking experiments.
Most frequently, chemical cross-linkers are employed but it is also possible to generate recombinant bait proteins with genetically encoded unnatural photo-reactive amino acids (like photo-Leu or photo-Met or pBpa). The first class of crosslinkers, i.e. chemical crosslinkers, possess two reactive moieties that react with specific amino acid residues in proteins. If two proteins are in close proximity, the crosslinker will react chemoselectively with distinct amino acid residues on these proteins, thereby covalently linking them. The second class of crosslinking agents are incorporated in recombinant proteins by genetic code expansion strategies. To this end non-natural amino acids with photoreactive side groups are incorporated during translation in the protein sequence. Their crosslinking potential is triggered by irradiation with light of suitable wavelength. The photoactivated group will then insert into the amino acid backbone of nearby interacting proteins. This again results in a covalent linkage. Independently of the type of crosslinker, the crosslinked samples are subsequently prepared for mass spectrometry (digestion with e.g. trypsin, reduction/alkylation and StageTipping) and the crosslinked peptides are analysed by LC-MS. The sequence of the two peptide strands allows the identification of the two interacting proteins and the length of the cross-linker allows to estimate the spatial distance between the linked proteins in the crosslinked regions (see also image below).
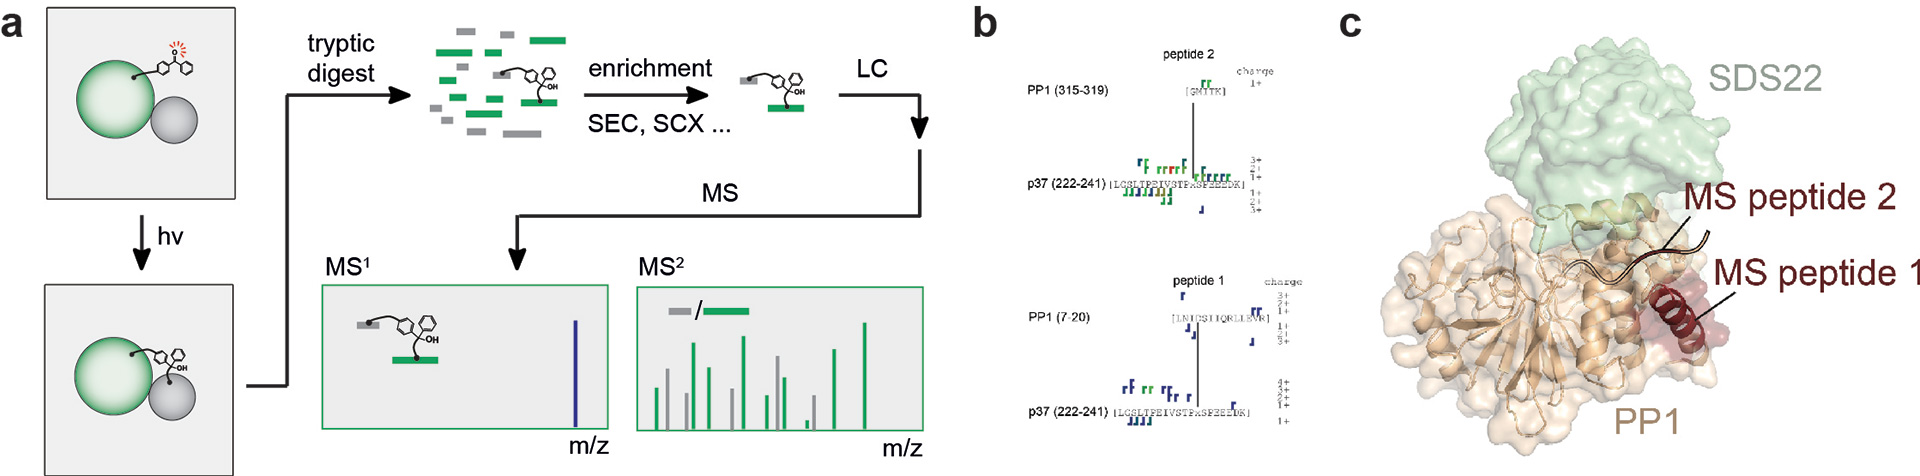
MS workflow for genetically-encoded photo-activated crosslinkers. This approach serves to pinpoint molecular interactions in protein complexes. (a) Overview of the MS workflow. A protein with e.g. suspected interaction domain is overproduced incorporating the artificial amino acid pBpa in the domain of interest. After reconstitution of the complex the sample is irradiated with UV light. The benzophenone group is photoactivated and inserts into the protein sequence of interacting partner proteins. After cross-linking, the proteins are digested and crosslinked peptides enriched by a suitable method (e.g. SEC or SCX). The enriched samples are subsequently analysed by LC MS. (b) Sequences of peptides from the protein phosphatase-1 (PP1) binding partner p37 with pBpa at position 234 cross-linked to peptides from PP1 using the approach described in (a). The two crosslinked peptides were assigned to the N-terminal region (peptide 1, bottom) and C-terminal region (peptide 2, top) in PP1. (c) Mapping of the crosslink peptides from (b) on the SDS22-PP1 crystal structure (pdb 6obn) (Kracht et al. 2020).
Both CL-MS strategies have already been successfully established (unpublished data). However, the analysis of crosslinking samples is not a routine task and requires optimization and adaptation of sample preparation and MS machine parameters. Talk to us.
Quantitative mass spectrometry
(SILAC, iTraq/TMT, MudPIT, label free quantification …)
The Orbitrap Elite and the Fusion Lumos together with the extremely reliable and reproducible Easy-nLC’s allows us to cater for almost all quantitative bottom-up proteomics questions. If you would like to give this a try, please contact us.
Native Mass Spectrometry
The Exactive PLUS EMR system enables measurements of proteins and protein complexes in their native state. With its extended mass range of m/z 20000 this machine is able to determine the mass of complexes up to 2 MDa (2×10⁶ Da). Native MS is not trivial and almost every protein and complex needs individual setup of conditions and parameters. Therefore, we are not offering this technique as a full service. If you would like to give this a try we will give you access to the machine and after an introduction you will have to fine tune the best settings for your project. The technique works best with highly purified protein samples. Calculate enough time (one full week per protein you are interested in).
Activity-based protein profiling (ABPP)
Reporter-modified small molecules known as activity-based probes (ABPs) are applied to functionally analyze proteomes of interest. Depending on the ABP, ABPP allows to determine the activity state of distinct active enzymes in various physiological conditions. Analysis of active enzymes is then achieved by 1D or 2D gel electrophoresis and/or mass spectrometry.
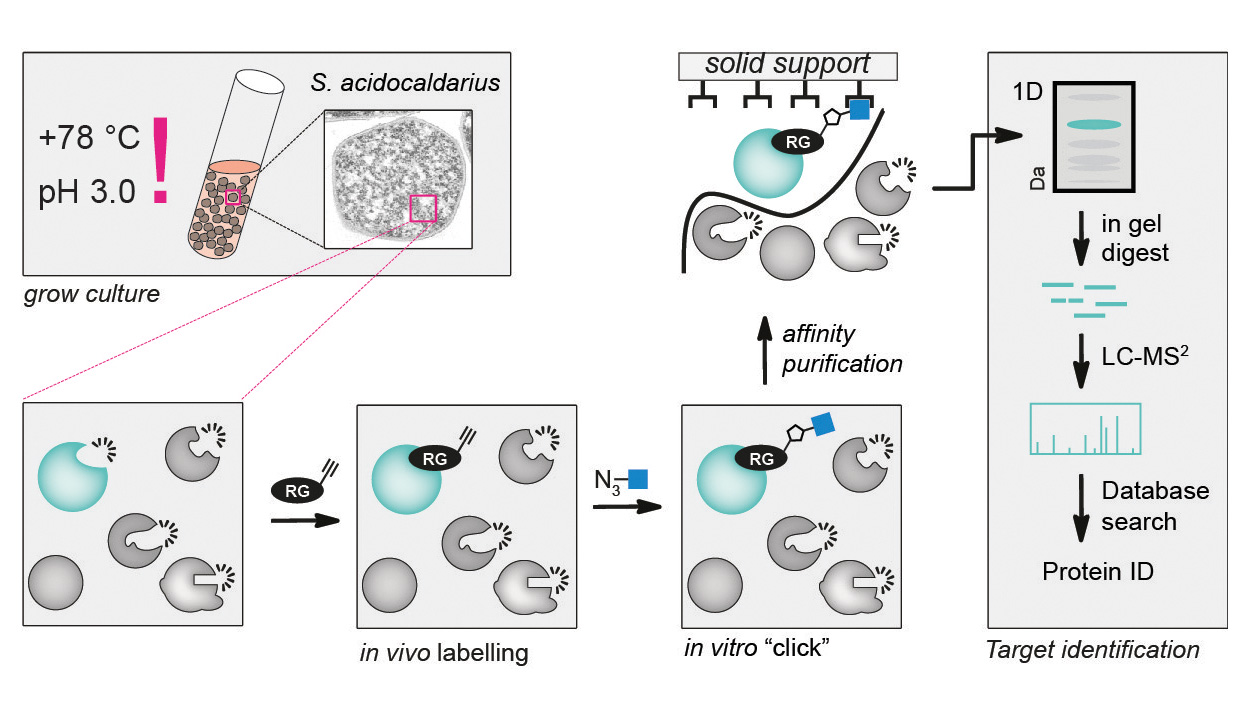
Example workflow for in vivo ABPP of serine hydrolases in archaea bacteria. Cells are grown in liquid culture and labelled in vivo with a click chemistry compatible probe. After in vivo labelling proteins are extracted and a suitable reporter or affinity purification tag is ‘clicked’ on to labelled proteins. Labelled proteins are then affinity purified and subsequently separated by SDS–PAGE. After excision of the labelled proteins from the gel and tryptic in-gel digestion the respective proteins are identified by LC–MS/ MS (taken from Zweerink et al. 2017).
1D and 2D gel electrophoresis of proteins
We routinely analyze protein samples by electrophoresis. Depending on the nature of the sample or the envisioned down-stream processing, we use several different gel systems. For routine applications, we usually use classic Tris/Glycine gels. For MS sample preparation, special Bis-Tris gels are used, while very small proteins are run on Tricine gels. All gels are cast in our lab with components suitable for MS analysis. The gel recipes can be adjusted to your needs.
We can run up to 100 protein samples on one gel (maxi gel) which can be quite handy if you want to test different reaction conditions. To detect proteins, we either stain gels with colloidal Coomassie or we use fluorescent stains (SYPRO Ruby). The latter can be quantified with our Typhoon fluorescence scanner.
2D-DIGE
This is a very powerful technique for the comparison of two proteomes (e.g. wildtype vs. mutant). Each proteome is chemically modified (labeled) with an individual dye (e.g. Cy3 and Cy5). The two dyes have different spectroscopic properties. After labeling, the two samples are mixed together and resolved in the first dimension according to their isoelectric point and then in the second dimension according to their size (SDS-PAGE). By using different channels on a Typhoon fluorescence gel scanner for each fluorescent dye, a spot pattern for each proteome can be visualized. The two images can be compared and signals quantified. The quality of the analysis can be even boosted by using an internal standard (another fluorescent dye; Cy2) and by analyzing biological replica. Interesting spots (showing differences) can be cut-out and subjected to in-gel digestion with trypsin and subsequent MS-analysis to identify the proteins.
Addendum Jan 2021: Please note that we do not offer this technique anymore as a service. Almost all our collaborators have switched to gel-free quantitative MS methods. We still have the necessary equipment and you may use it in our labs. Give us a call if you are interested.